The normal distribution is a fixture in any first course on statistics. My experience teaching the topic is almost entirely in courses servicing students whose main interest is elsewhere: management, accounting, science or psychology. My approach is I guess typical; I present the distribution as a picture like the one below. I claim that this is a useful model for a continuous random variables and explain how probabilities are given by areas under the curve.

Here the constant 

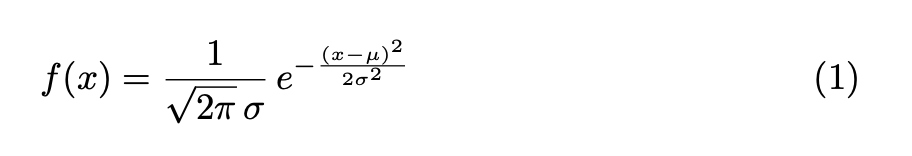
Frightening hey? even the words “probability density function” may scare the horses. I do however teach that the standard deviation is the horizontal distance between the mean and the points of inflection either side which seems to give some feeling for the curve.
Some useful properties of the normal distribution are common sense. For example, if 


In case you are also confused, the general principle is that if 


Switching to romantic mode …
It seems that Gauss had an unerring nose for the profound. When two Gaussian functions convolve, their offspring is … another Gaussian. Other L2 functions, those that are not Gaussian, seem to aspire to this; when they convolve their children are smoother and closer to Gaussian in shape. The Fourier spectrum of a Gaussian is a Gaussian. The Heisenberg uncertainty principle is the physical equivalent of a mathematical inequality where the extreme case is a Gaussian. Less surprising is that, in Young’s convolution inequality, the critical case is for Gaussians, and this solves a problem relating to Bonsall’s generalization of Hilbert’s famous inequality. All of this relates somehow to the unsolved mystery of the operator norm of the Laplace transform. Perhaps a taste of Gauss’s formula is warranted in secondary schools. Maybe just 
 at the front. Most problems involving transformations of normal random variables can be correctly handled, just using expectations of mean and variance, which I think is in the syllabus. So, do we need to show the pdf formula?
Leave a reply to JJ Cancel reply